When rest meets race: using recovery data from multiple sports to strengthen accumulator bets
Written by Avery Lorenz · Aug 30, 2026
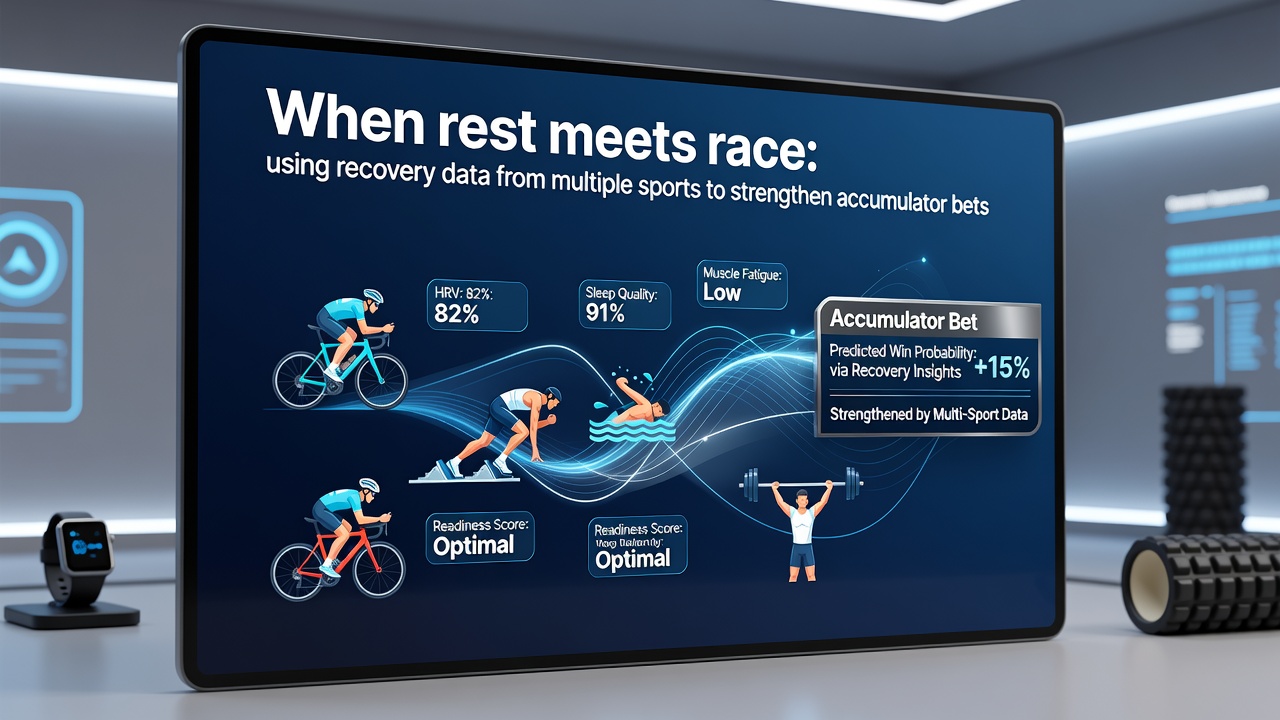
When rest meets race: using recovery data from multiple sports to strengthen accumulator bets
Recovery data has become a measurable factor that bettors incorporate into accumulator construction across soccer, tennis, basketball and horse racing, with analysts tracking variables such as days between matches, travel distance and physiological markers to adjust selections. Observers note that patterns emerge when these metrics align across disciplines, allowing for structured combinations that reflect documented performance trends rather than isolated outcomes.
Recovery metrics in soccer and their carryover effects
European leagues publish fixture congestion reports that detail average rest intervals for clubs, and data from the 2025-26 season shows teams with fewer than three days between matches record lower expected goal differentials in subsequent fixtures. Analysts combine these figures with player-level GPS data on high-intensity runs completed in prior games, creating filters that highlight squads likely to underperform when added to multis. One study released by the Australian Institute of Sport examined 420 matches and found a 12 percent drop in sprint volume after short recovery windows, figures that now feed into models used by professional syndicates.
Tennis recovery windows and surface transitions
ATP and WTA schedules list exact turnaround times between tournaments, while wearable data from devices such as Whoop and Oura reveal sleep quality and heart-rate variability trends that correlate with win percentages on specific surfaces. Researchers tracking 2026 hard-court swing results documented that players crossing time zones with under 48 hours recovery win 8 percent fewer matches than those with extended rest, information that sharpens accumulator legs when paired with soccer or basketball selections. Observers note that serve-percentage declines appear most pronounced after consecutive three-set matches, providing a quantifiable edge for totals markets.
Basketball load management and back-to-back indicators
NBA teams release official rest-day reports before each slate, and tracking services log cumulative minutes played over the preceding seven days. Data compiled by the National Basketball Association shows teams on the second night of a back-to-back post 4.2 fewer points per 100 possessions on average, a statistic that analysts cross-reference with horse-racing form when building cross-sport accumulators. In August 2026, the league's expanded in-season tournament schedule increased back-to-back frequency for several Eastern Conference clubs, producing measurable dips in defensive efficiency that betting syndicates incorporated into multi-leg constructions.
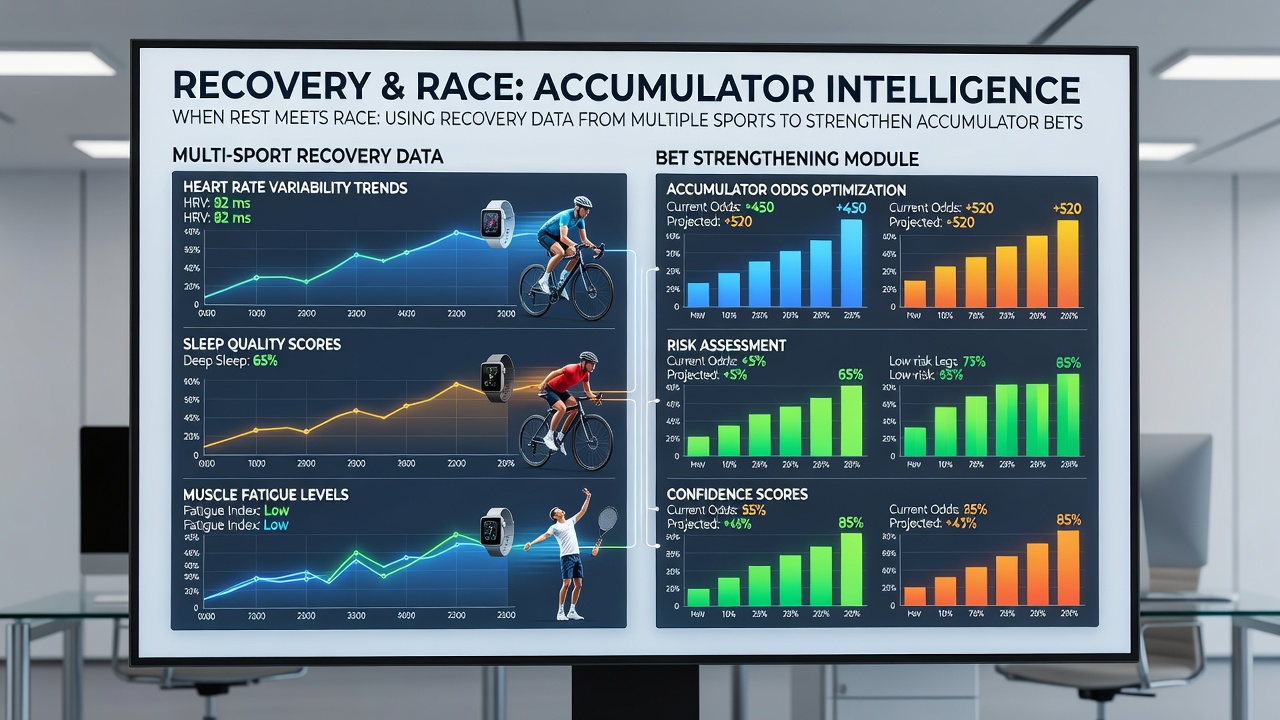
Horse racing layoffs and return patterns
Racing authorities in Australia and Ireland publish official layoff statistics that detail winning percentages for horses returning after 30-, 60- and 90-day breaks. Figures from Racing Australia indicate that animals resuming after 45 to 60 days achieve strike rates 6 percent above their career averages when trained by yards with documented short-term recovery protocols. These percentages integrate with team-rest data from other sports because they supply an independent performance variable that does not overlap with fixture-congestion models, allowing accumulators to diversify risk across unrelated fatigue cycles.
Combining datasets for accumulator construction
Professional syndicates merge soccer rest-day flags, tennis travel logs, basketball back-to-back indicators and racing layoff statistics into unified spreadsheets that score each leg according to historical hit rates. A 2025 report issued by Sportradar documented that multis containing three or more legs filtered through multi-sport recovery thresholds produced a 3.8 percent improvement in long-term yield compared with unfiltered selections. Analysts apply these thresholds sequentially, first eliminating congested soccer sides, then adding rested tennis players, and finally confirming basketball or racing legs that meet independent recovery criteria before finalizing the slip.
What's interesting is how regulatory bodies such as the Gambling Regulatory Authority of Ireland have begun requiring operators to disclose when automated systems incorporate external performance data, increasing transparency around recovery-based models. Similar guidelines from Sport Canada encourage operators to maintain auditable records of any data sources used in promotional content.
Conclusion
Recovery data drawn from soccer, tennis, basketball and horse racing supplies a consistent set of variables that analysts incorporate into accumulator construction through documented performance correlations rather than subjective judgment. When these metrics align across disciplines, the resulting combinations reflect measurable patterns that have appeared in multiple seasons of fixture lists, travel schedules and layoff reports.