Fixture Density Shifts Performance Patterns in Multi-Sport Betting Markets
Written by David Patterson · Oct 25, 2026
Fixture Density Shifts Performance Patterns in Multi-Sport Betting Markets
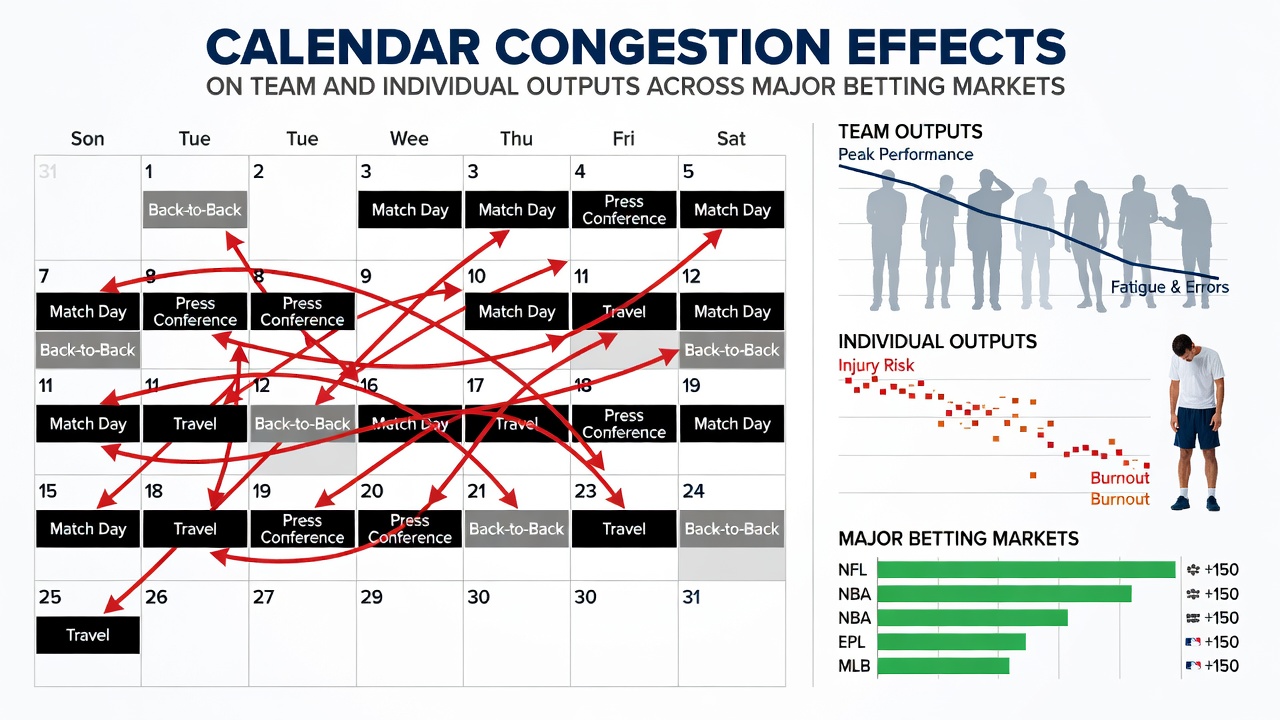
Calendar congestion emerges when sports organizations pack multiple competitions into short windows, and this pattern alters outputs for teams as well as individual athletes in ways that reshape betting markets for football, horse racing, tennis, and basketball. Observers note that fixture overloads reduce recovery time, change win probabilities, and influence market movements in major wagering sectors.
Football League Congestion and Squad Outputs
European domestic leagues and continental tournaments often overlap during autumn months, forcing clubs to manage players across three or four matches per week, and data from the 2025-2026 season shows elevated injury rates when teams play five matches in fourteen days. Researchers at the University of Loughborough tracked match statistics and found that teams with fewer rest days recorded lower pass completion percentages and reduced distance covered at high intensity, metrics that directly affect over/under and handicap markets. In October 2026 several Premier League sides face midweek fixtures followed by weekend rounds, creating measurable dips in expected goals that betting models adjust for when lines open.
Individual Athlete Responses in Tennis and Basketball
Tennis players encounter back-to-back tournaments on different surfaces, while NBA and Euroleague schedules compress travel across time zones, and studies from the Australian Institute of Sport indicate that consecutive high-effort matches increase unforced error rates by measurable margins in later rounds. Basketball data reveals that players logging over thirty-eight minutes per game during dense stretches post lower field goal percentages in the final quarter, information that informs player prop markets. Those who monitor recovery windows note that individual outputs decline more sharply than team averages because single athletes cannot rotate responsibilities the way squads distribute workload.
Horse Racing Meet Density and Performance Metrics
Racing calendars intensify during autumn festival periods, with horses entered across consecutive days at major tracks, and records compiled by Racing Australia demonstrate that animals running on short rest intervals show slower final furlong splits compared with those granted standard recovery periods. Trainers adjust preparation routines when meetings cluster, yet historical results indicate that favorites win at reduced rates under such conditions, shifting odds in win and place markets. Observers track these patterns because they influence accumulator selections that combine racing with other sports.
Cross-Market Implications for Accumulators
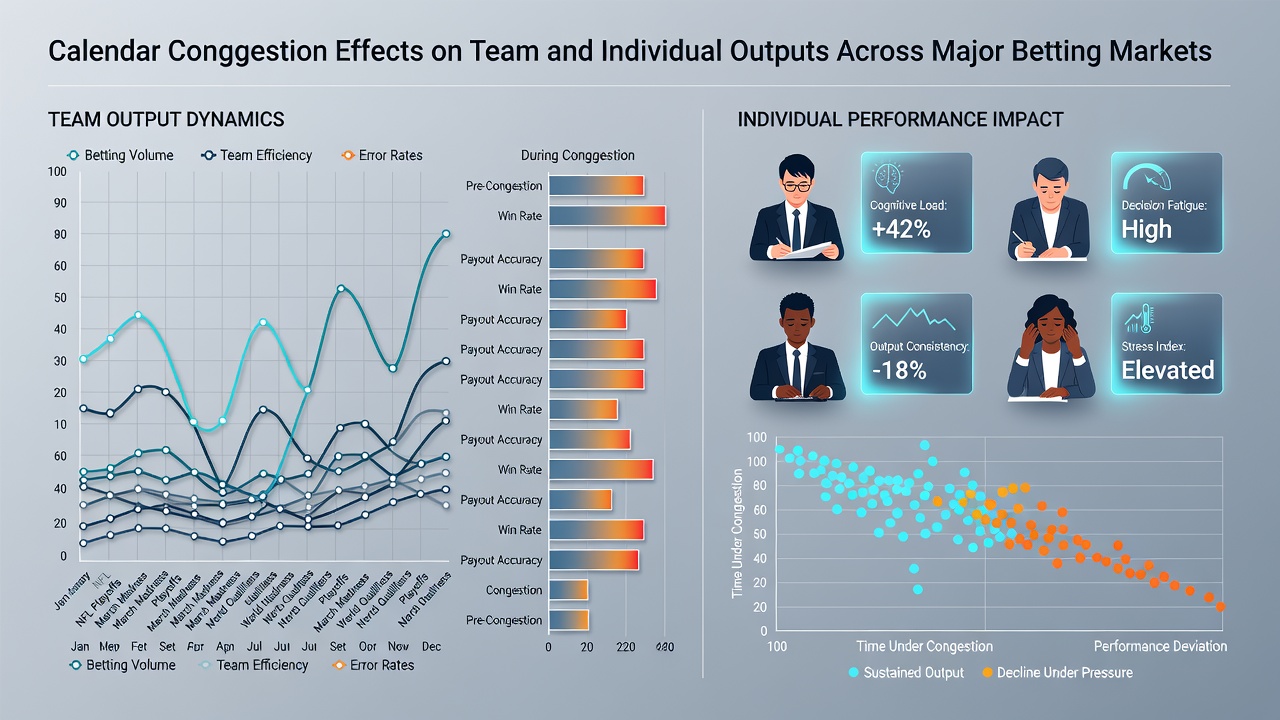
Betting operators and analysts incorporate congestion variables into pricing engines because reduced outputs in one sport correlate with altered probabilities when events from different disciplines appear in the same multiple. Figures released by the European Gaming and Betting Association highlight that markets adjust more rapidly when fixture lists become public, particularly for combinations involving football midweeks and tennis tiebreak totals. In October 2026 overlapping international breaks with domestic rounds create additional layers that syndicates monitor for value shifts across horse racing and basketball props.
Recovery Data and Market Adjustments
Longitudinal research conducted by Canadian sport science groups reveals that teams and athletes granted at least seventy-two hours between exertions maintain closer to baseline statistical outputs, whereas shorter gaps produce measurable declines in key indicators such as clean sheets, serve hold percentages, and rebound rates. These findings feed into predictive models that update lines before markets open, and sharp bettors who factor calendar density often identify discrepancies before the general public adjusts. The result appears in tighter spreads and modified totals when congestion peaks.
Conclusion
Calendar congestion produces consistent, quantifiable effects on both collective and personal performance metrics across the four major betting sports, and market participants incorporate these patterns through statistical modeling and historical comparison. Data from multiple jurisdictions continues to refine how operators set lines and how bettors evaluate selections when schedules tighten.